Contact us
Our team would love to hear from you.
Are you struggling to turn complex data into meaningful insights? Tired of boring and confusing dashboards? Our data visualization consulting experts can help you tell the stories hidden in your data. With years of experience in providing data visualization services, our high-quality solutions turn everyone into a data-driven decision maker.

industries
In the healthcare domain, data visualization can be used to transform complex medical stats like patient data, treatment outcomes, patterns for prescribing medications, etc. into an easy-to-digest graphic format. It helps make valuable decisions even without data analysis skills.

The trading industry deals with large amounts of data, and data visualization helps traders make fast, informed financial decisions. With real-time visualization tools, traders can monitor stock prices, analyze financial trends, and quickly detect anomalies that affect their operations.

In the cybersecurity field, data visualization services can help monitor network traffic, detect vulnerabilities and spot anomalies that indicate a breach. With advanced visualization and analysis tools, cybersecurity professionals can quickly identify threats and improve incident response time while reducing security risks.

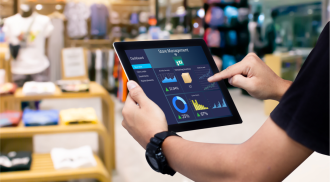
Retail companies can use data visualization to analyze customer behavior, trends, and preferences, which can help retailers improve their services or store layouts. Visual analytics is a must for retailers to maintain and strengthen their position in the global market.
Using data visualization tools, the teams that monitor a company’s manufacturing processes can quickly identify problem areas and take immediate corrective action by mobilizing the right people and making data-driven decisions. In addition, access to data visualization tools enables shortening the improvement cycle.

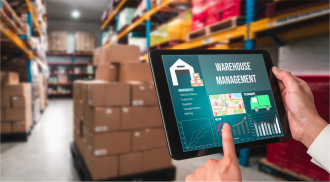
In the logistics industry, data visualization can be used to track transportation routes and monitor and optimize delivery schedules. Real-time dashboards can provide insights into inventory levels and product demand, which can help logistics companies reduce delivery costs and improve service quality.


solutions
Identify your organization’s needs and goals and implement the best data visualization techniques for your business with our data visualization consulting services. Our expert consultants will help you make optimizations that improve your workflows and understanding of your data, while providing deep, real-time insight into business trends and processes.
Our data visualization experts can help you transform your data into compelling, interactive visual stories that drive better decision-making. We work with the latest data visualization tools and technologies to create custom dashboards, reports, and infographics that make your data easy to understand and analyze. From design to implementation, we’re a full-service data visualization agency.
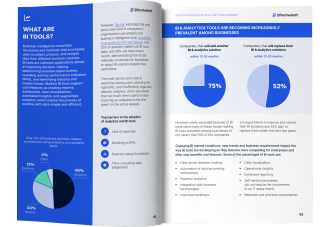
Choosing an appropriate BI tool can be time-consuming and can use up a lot of resources. In order to avoid these difficulties, we have outlined some important points to consider when choosing a BI tool.
services
Customized dashboards are an essential tool in modern business operations. They provide a tailored view of a company’s data, highlighting its most essential tasks and information. At EffectiveSoft, we leverage our expertise in data visualization to create dashboards that give our clients a comprehensive real-time overview of their operations. With these dashboards, our clients can keep track of their changing data in one place and quickly gain valuable insights into their business. This enables companies to make decisions more efficiently and stay competitive in today’s fast-moving business environment.
EffectiveSoft specializes in designing interactive reports that offer real-time actionable insights to clients. Compared to traditional static reports which lack flexibility, interactive reports enable users to navigate information by allowing for data discovery, drill-down analysis, filtering, and sorting. If enhanced with visual elements, interactive reports are even more dynamic, engaging, and easy to track. With our interactive reports, users can actively explore data rather than merely consuming it.
EffectiveSoft helps employ visual communication to translate massive data sets into compelling stories using data storytelling. This is used to influence and inform a particular audience. Through data storytelling, complicated information is simplified so that the target audience can engage with content and make critical decisions quicker and more confidently.
This service allows creating maps that highlight data points and trends across geographic locations. These can be spatial heatmaps for identifying clusters of activity, geospatial fleet-tracking maps for precise location tracking of vehicles, or indoor point cloud visualization for 3D mapping and design. These tools enable businesses to explore data in more detail based on region, country, or other factors.
process
The common steps involved in the data visualization process after data analysis has been performed include:
methods
Visuals are never chosen at random. They tell a unique data story through the interpretation. Each type of visual corresponds exactly to the idea of the data being explained. Here is a brief overview of basic data visualization methods.
A bar chart is a simple and effective way to display data using rectangular bars of different heights or lengths. Bar charts can show a comparison of discrete categories or continuous measurements over time.
A pie chart is a chart that displays values as slices of a pie. The size of each slice corresponds to the proportion of total value it represents, making it useful for showing the proportion of a whole.
A heat map uses color to represent data values on a two-dimensional plane. Heat maps can highlight areas of high/low concentration or correlation, useful for showing patterns in large datasets.
A line graph uses a line to connect data points and can illustrate trends over time or show relationships between variables. Line graphs can reveal patterns or outliers in data that may not be apparent in other chart types.
A scatter plot shows the relationship between two variables, with each point representing a single observation or data point. Scatter plots can reveal clusters or outliers, as well as the overall trend of the data.
Funnels show tighter correlations between different groups of items. These groups are distinguished by geometric shape and color coding.
We are excited to explore further and gain insight into your unique requirements in order to unleash the full power of data visualization for your business. By understanding your obstacles and objectives, we can customize our solutions to best meet your needs.
tech stack
The most common data visualization tools are:
A technology-driven business analytics service that provides interactive visualizations and business intelligence capabilities. It converts data from different sources to build interactive dashboards, BI reports, and more.
A powerful end-to-end data visualization tool that allows users to interactively explore and visualize any data from anywhere. Equipped with a range of charts and graphs, it easily and promptly turns data into actionable insights.
A platform that offers a wide range of analytic scenarios and enables users to import and consolidate data from multiple sources. With self-service analytics, interactive dashboards, reporting, and more, it supports a full data lifecycle.
A powerful analytics solution that allows organizations of all sizes to easily visualize and analyze massive data sets in real time. It empowers users with actionable insights for better decision making through an intuitive interface and advanced reporting capabilities.
An AI-powered data visualization tool that helps companies quickly and easily create interactive reports and dashboards. Through an intuitive interface, users can connect to multiple data sources and make business decisions based on real-time insights.
A flexible, cloud-based data visualization software that enables facilitated analysis of complex data sets. With advanced dashboards and reporting capabilities, Sisense empowers users to make data-driven decisions quickly and effectively, without the need for extensive technical expertise.
A cloud-based data visualization solution that helps organizations gain valuable insights from their data. With an easy-to-use interface and advanced analytics capabilities, Domo streamlines the data analysis process and enables users to create interactive dashboards that deliver valuable results in real time.
An open-source data visualization and monitoring platform that helps to visualize and analyze time-series data in real time. With its advanced analytics tools and scalable architecture, Grafana enables organizations to gain valuable insights that can increase operational efficiency and improve decision making.
our advantages
We are one of the leading data visualization companies, with years of experience helping clients visualize complex data. Our team of data visualization experts has in-depth knowledge of the latest data visualization tools and techniques and can design custom solutions for your business needs.
Whether you need help with a one-time project or ongoing support, we offer flexible and customizable solutions that meet your specific needs. Our data visualization consulting services are tailored to your organization’s needs and goals, so you get the right solution at the right price.
We are committed to delivering top-quality solutions that are reliable, scalable, and user-friendly. Our data visualization experts deliver meaningful insights that drive better decision-making, no matter how complex your data is.
Our approach to data analytics services is collaborative, and we work closely with you to understand your unique data visualization needs. We’re not just a data visualization company, but a trusted partner who can help you unlock the full potential of your data.

Data visualization is the process of transforming complex data sets into clear, concise, and easily understandable visual representations.
You don’t have to build data visualizations from scratch. You can quickly leverage a platform’s capabilities to automate the reporting process and prepare data using the platform’s data preparation tools. For small and mid-sized businesses, customizing a platform to fit your needs is usually easier and less expensive than building from scratch. Considering the limitations of the platform and the size and requirements of your business, we can help you choose the best solution.
As your organization grows, the amount of data it produces increases, making it difficult to find a platform that fully meets your business needs. With custom solutions, your enterprise can standardize its requirements and present complex data sets using advanced analytics and more sophisticated business logic. With our custom solutions, you can integrate new business processes and measure the results of their implementation in near real time.
The potential pitfalls of data visualization can hinder the effectiveness of the visual representation. Some of the challenges that can occur include:
Utilizing the wrong visualization format. Applying the wrong format can result in confusion and misunderstanding. For example, using a spider chart when comparing only one characteristic can be unclear, while applying a line graph to compare multidimensional units can be overwhelming.
Using the wrong type of data. It is essential to understand what type of data can be applied to your chosen data visualization tool. Choosing the wrong type of data can lead to inaccurate representations, causing misinterpretation of the data.
Choosing inappropriate tooling. Selecting a vendor with the wrong capabilities or tools can lead to limitations on the amount of data that can be processed, the frequency of updates, and visualization capabilities.
To avoid these pitfalls, it’s crucial to work with a qualified data visualization specialist who can help navigate the complexities of the data and select the correct visualization format, data types, and tools.
Can’t find the answer you are looking for?
Contact us and we will get in touch with you shortly.
Our team would love to hear from you.
Fill out the form, and we’ve got you covered.
What happens next?
San Diego, California
4445 Eastgate Mall, Suite 200
92121, 1-800-288-9659
San Francisco, California
50 California St #1500
94111, 1-800-288-9659
Pittsburgh, Pennsylvania
One Oxford Centre, 500 Grant St Suite 2900
15219, 1-800-288-9659
Durham, North Carolina
RTP Meridian, 2530 Meridian Pkwy Suite 300
27713, 1-800-288-9659
San Jose, Costa Rica
C. 118B, Trejos Montealegre
10203, 1-800-288-9659